Dashboard Overview
The Dashboard is the first thing you see when you open Holltask, and it's designed to give you a quick snapshot of everything that matters—all in one place, all at a glance.
What is the Dashboard?
When I built the Dashboard, I wanted it to be the place where you could see your progress and your day without having to click around. It pulls together data from all the other modules so you can see what's happening across your entire life in one view.
Key Features
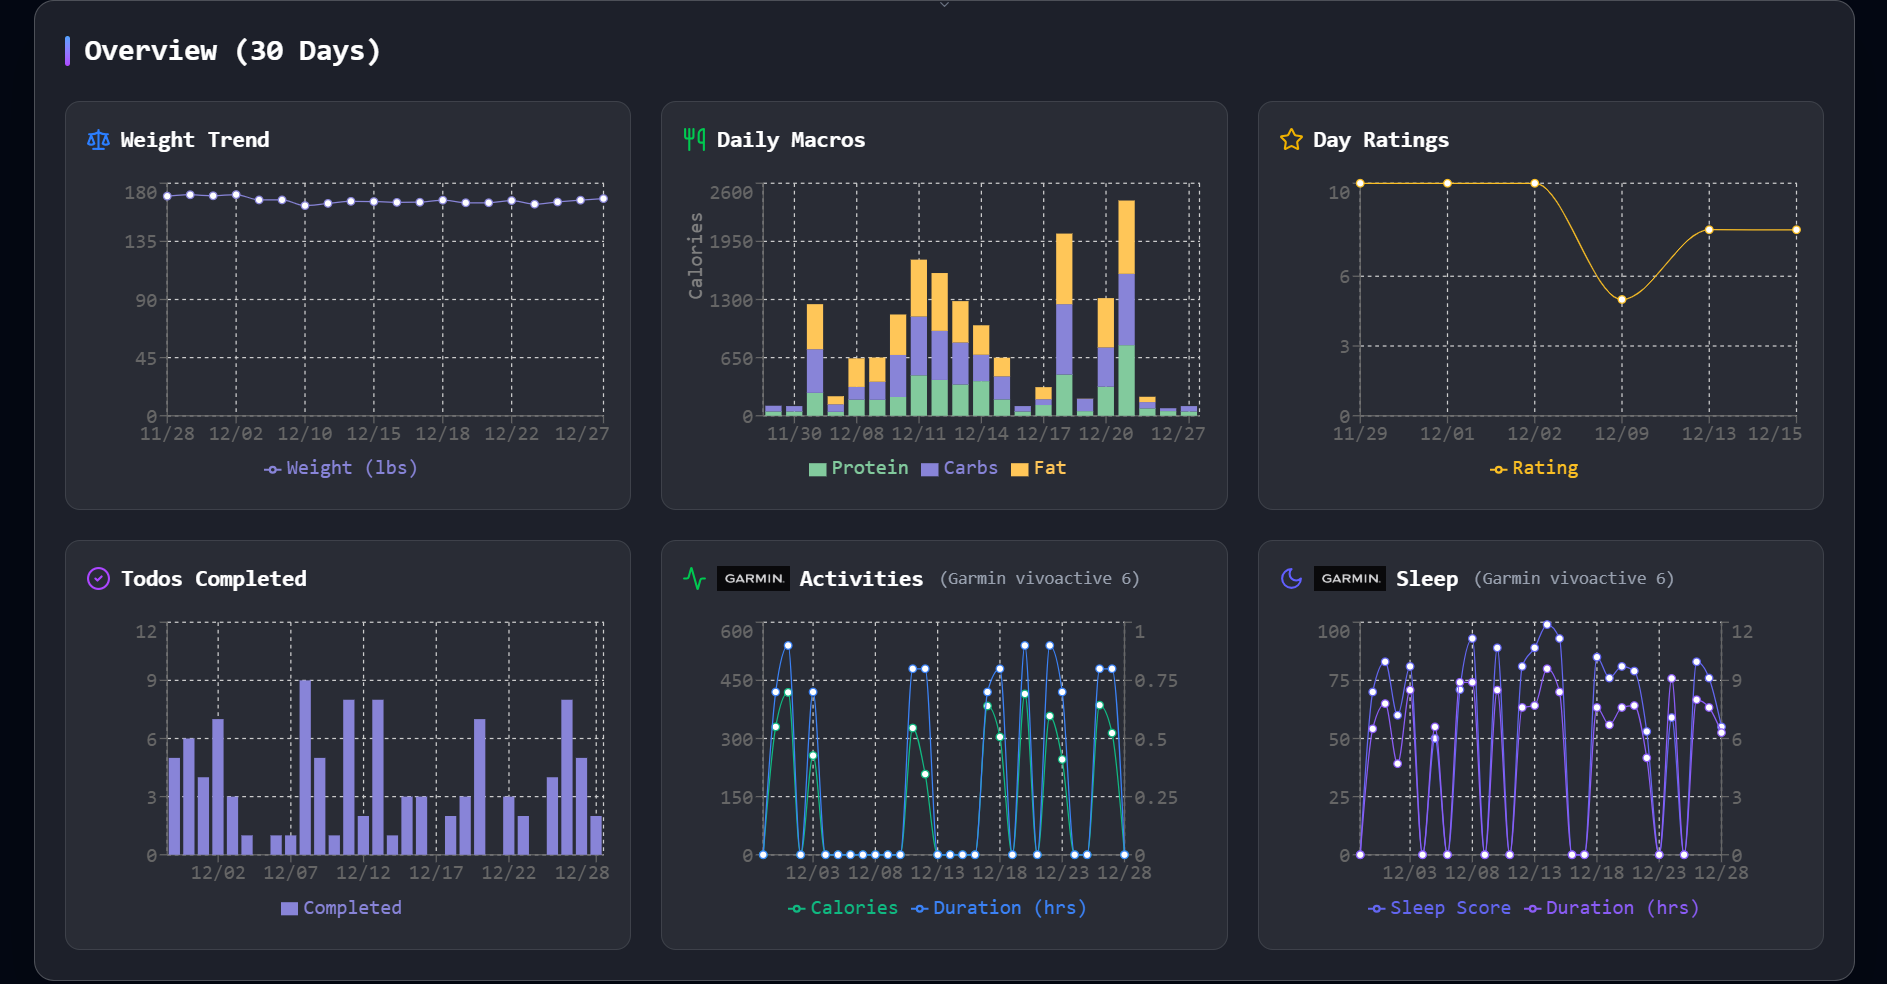
At-a-Glance Graphs
At the top of the Dashboard, you'll see four graphs displayed side by side:
- Weight - Track your weight over time
- Daily Macros - See your protein, carbs, and fats for the day
- Day Rating - How you've been rating your days
- Todos Completed - Your task completion over time
Having these graphs right next to each other lets you quickly spot patterns and see how different aspects of your life are connected. Maybe you notice that on days when you complete more todos, you also rate your day higher. That kind of insight is what makes the Dashboard useful.
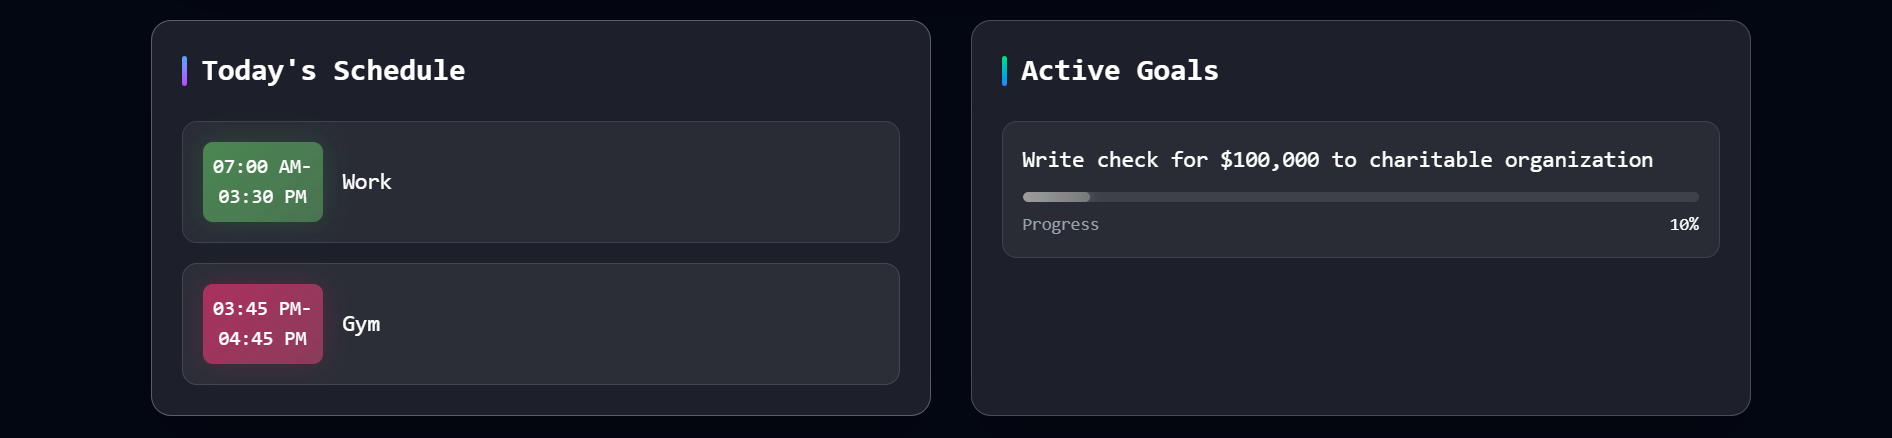
Today's Schedule
Right below the graphs, you'll see your schedule for today. This shows you what's coming up, what you need to prepare for, and helps you plan your day accordingly.
Active Goals
The Dashboard also displays your active goals, so you can see what you're working toward without having to navigate to the Goals page. It's a constant reminder of what matters to you.
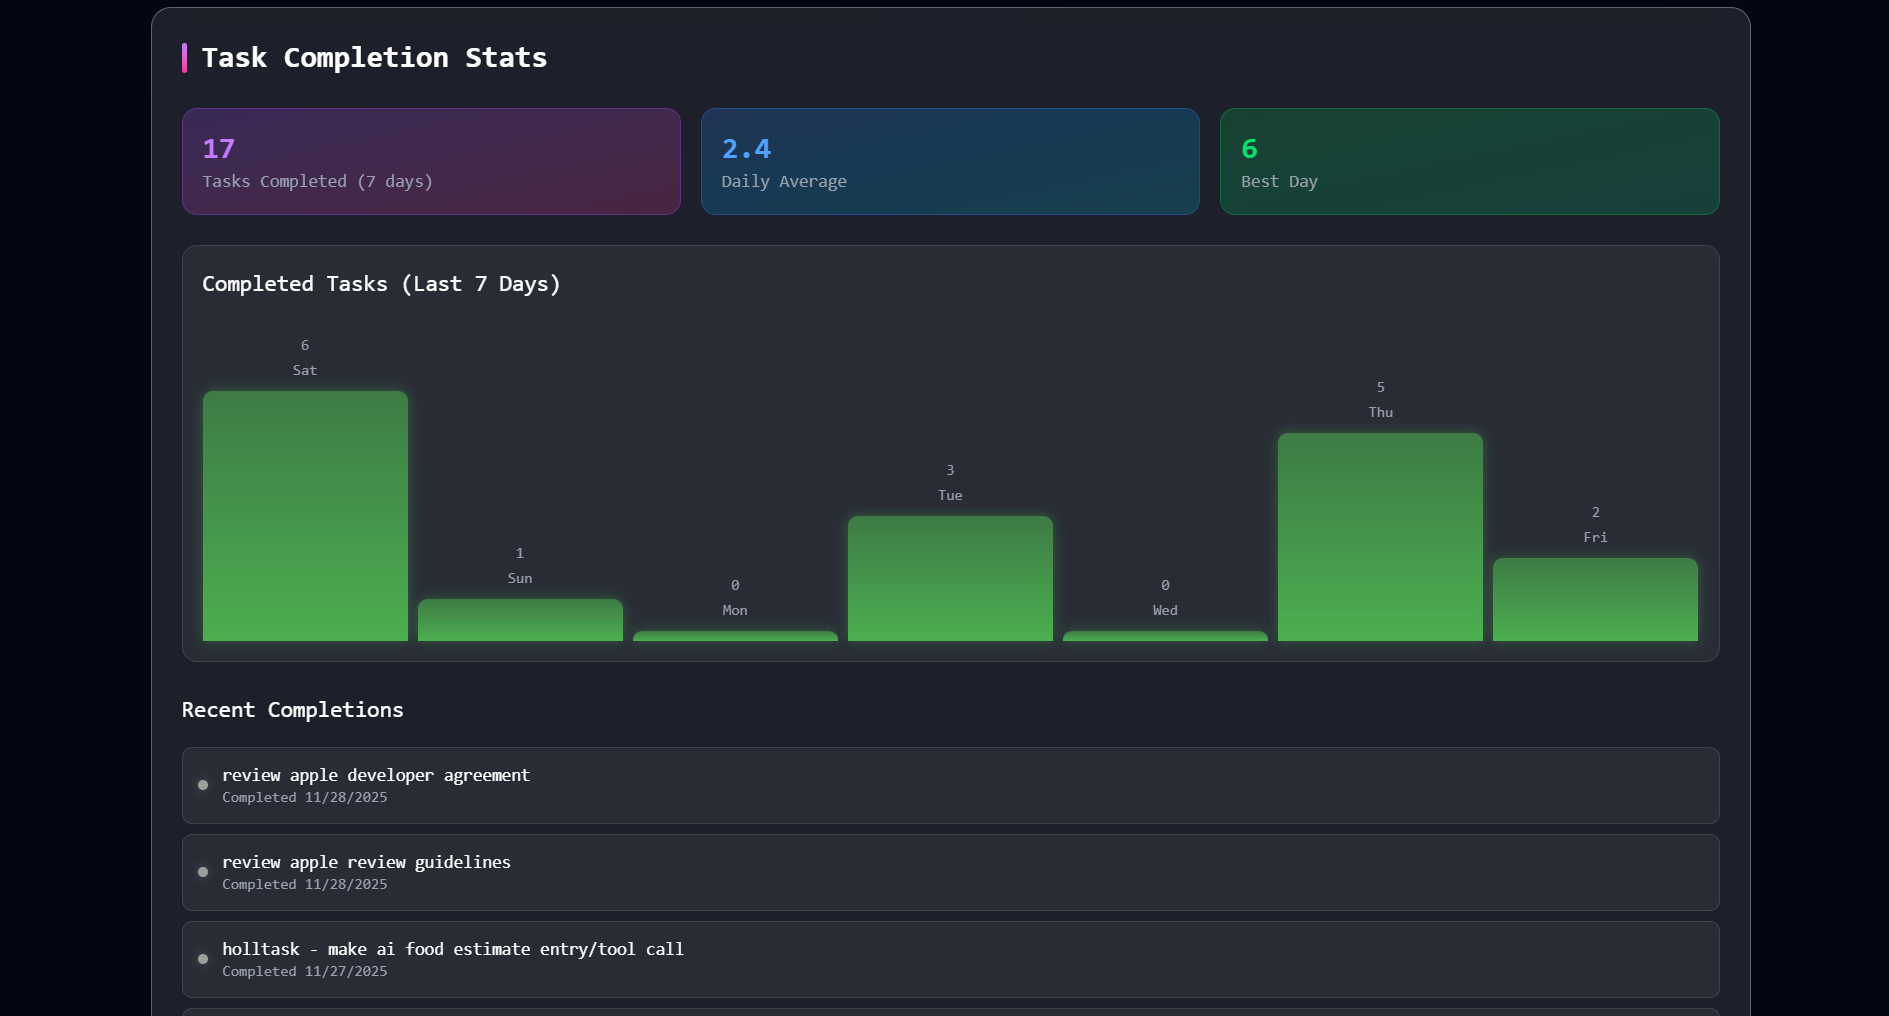
Todo Completion Stats
Lastly is the todo completion stats. It shows:
- Last 7 Days - How many todos you've completed in the past week
- Daily Average - Your average todos completed per day
- Best Day - The day you completed the most todos (your personal record!)
- Last Completed - A couple of your most recently finished todos